Kids Math
Glossary and Terms: Probability and Statistics
Average - The average is a number that is one way to find the typical value of a set of numbers. You find the average by adding up all the numbers and then dividing the total by the number of numbers in the set.
Example:
To find the average of the data set (1, 3, 3, 4, 4, 5, 8)
Add all the values together 1+3+3+4+4+5+8 = 28
Then divide by the total number of values 28 ÷ 7 = 4
The average value is 4.
Correlation - A measurement of how closely related two variables are.
Dependent event - Events are dependent if the occurrence of either event affects the probability of the occurrence of the other event. In other words, one event depends on the other.
Event - A collection of outcomes from an experiment.
Extrapolate - Extrapolation is a way to estimate values beyond the known data. You can use patterns and graphs to determine other possible data points that were not actually measured.
Frequency - The frequency is how often an event occurs during a specific amount of time.
Interpolate - Interpolation is a way to estimate data. When you interpolate you estimate the data between two known points on a graph. This can be done by drawing a curve or line between the two points.
Interval - The set of numbers between two other numbers in a data set. It often refers to a period of time between two events.
Mean - The mean is the same as the average. It is a way of determining the typical value of a data set. The mean is found by adding up all the numbers and then dividing them by the total number of numbers. See average above for an example.
Median - The median is the halfway point in a set of numbers. It can be different from the mean or average. If you line up the numbers in a data set from least to greatest, the median would be the middle number.
Example: The median of the data set (2, 3, 7, 12, 45) is 7.
Mode - The mode is the number that occurs the most often in a data set.
Example: The mode of the data set (2, 2, 7, 8, 12, 7, 2, 14) is 2.
Outcome - The result of an experiment.
Percent - A percent is a special type of fraction where the denominator is 100. It can be written using the % sign.
Example: 50%, this is the same as ½ or 50/100
Probability - The probability is the chance that an event will or will not occur.
Random - If something is random, then all possible events have an equal chance of occurring.
Range - The range is the difference between the largest number and the smallest number in a data set.
Example: The range of the data set (2, 2, 7, 8, 12, 7, 2, 14) is 14 -2 = 12.
Ratio - A ratio is a comparison of two numbers. It can be written a few different ways.
Example: The following are all a way to write the same ratio: 1/2 , 1:2, 1 of 2
Slope - A number that indicates the incline or steepness of a line on a graph. Slope equals the "rise" over the "run" on a graph. This can also be written as the change in y over the change in x.
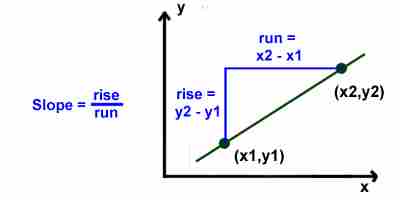
Example: If two points on a line are (x1, y1) and (x2, y2), then the slope = (y2 - y1) ÷ (x2-x1).
Statistics - Statistics are a set of data and numbers that are collected about a specific event or subject.
More Math Glossaries and Terms
Algebra glossary
Angles glossary
Figures and Shapes glossary
Fractions glossary
Graphs and lines glossary
Measurements glossary
Mathematical operations glossary
Probability and statistics glossary
Types of numbers glossary
Units of measurements glossary
Back to Kids Math
Back to Kids Study